Within this section on fiscal powers, the charts were updated based on information available in May 2019. The qualitative analysis dates from 2016 and will be updated as soon as possible.
OVERVIEW OF FISCAL DECENTRALISATION
Belgium is a federal state whose territory is divided into six federated entities (comprised of three linguistic communities, the Flemish-speaking, French-speaking and German-speaking communities, and three regions, Flanders, Wallonia and Brussels Capital), ten provinces and 589 municipalities.
Legal acts governing fiscal decentralisation
The Special Finance Act (SFA) of 1989 regulates the financing of the federated entities. It has been amended on several occasions, with the last revision to the devolution of spending responsibilities to the communities and regions embodied in the sixth state reform signed in 2011 and not yet fully implemented.
Qualifying fiscal decentralisation
Belgium is one of the EU countries with the highest levels of fiscal decentralisation. This was realised through waves of reforms (the last one approved in 2011) that have transferred a considerable number of competences to the regions and communities. A list and description of these is available. Under the last reform, the regions received economic and employment competences, while the communities received responsibility for family policy.
The regions and communities have their own governments and are not subordinated to the federal government in matters of expenditure policy.
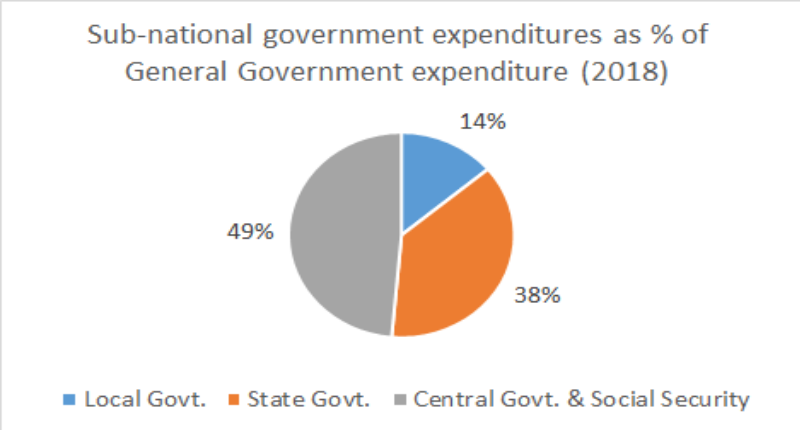
Sub-national governments (also including provinces and municipalities) spend about 40% of the total public budget (see the pie chart below), with the regions and linguistic communities playing the largest roles. However, the ability to finance spending through own resources is limited for regions and absent in the case of communities.
Indeed, communities were used to benefitting from revenues from a tax on the use of radio and TV, but in 2001 this was transferred to the regions and in Flanders and Brussels Capital, the tax was even abolished. Moreover, since 1980 the Constitution attributes some fiscal power to the communities, albeit very limited. However, in practice, this attribution clashes with the absence of any territorial basis to their competences. In particular, the exercise of any power of taxation encounters the problem of the communities not having exclusive competences over tax-payers in the region of Brussels Capital, which is bilingual. The latest reform has not changed this situation. Hence, the communities do not have any fiscal revenue of their own.
More generally, the type of revenue from which sub-national governments can benefit differs considerably from level to level.
Communities are mainly financed by shared tax revenues (i.e. taxes collected by the federal government and transferred to sub-national governments by means of a set of “repartition keys”) from personal income tax and VAT, by some non-tax revenues and possibly by borrowing.
Regions benefit from federal grants (raised mainly through personal income tax). Fixed, indexed, global resources are divided amongst the regions using repartition keys. The regions have the right to levy surtaxes on personal income tax raised at the federal level, but only Brussels Capital makes use of this possibility and raises 1 percentage point. The regions also receive own-source tax revenues, such as registration duties, property, succession and vehicle taxes, and some others. Similar to communities, they also enjoy some non-fiscal revenues.
The revision of the Finance Act of 2011 gives regions powers to set personal income tax rates on top of those imposed at the federal level, but this power is to a certain degree constrained to avoid unfair tax competition and to maintain the progressive nature of income taxation.
Provinces and municipalities do not share taxes with the federal level, but benefit from grants from the regions that can be either general or earmarked for specific projects. These amount to about half of their total financing. The rest comes from own-source taxes revenues, which are often surtaxes applied to basic rates set at the federal or regional level (e.g. on personal income tax or real estate tax), and from taxes levied at the local level (e.g. waste and leisure taxes), over which local authorities have full discretion).
Source: authors’ elaboration on EUROSTAT data. For further details, see methodology.
In 2012 the share of expenditure of the provinces and municipalities relative to total government expenditure was 13%, while that of the regions and communities amounted to 28%. These ratios have remained largely unchanged since 2000. A change is expected after 2015 when the sixth state reform will be fully in place. Based on Bisciari and VanMeensel (2012), and in line with the projections of the Federal Panning Bureau of 2014, the share of regions and communities should increase to above 30%, while that of social security and central government should shrink to below 55%.
Source: authors’ elaboration on EUROSTAT data. For further details, see methodology.
In Belgium, regions are characterised by quite a high level of revenue autonomy. About 40% of their total resources available come from own revenues, and on this portion the degree of tax autonomy is very high. Regions have full autonomy over taxation and enjoy exclusive competence (rate, basis and reliefs) over the large majority of regional taxes. By contrast, communities have an extremely low revenue autonomy and no fiscal autonomy. When pooling together regions and communities, revenue autonomy is at about 25%.
Fiscal equalisation mechanisms
Belgium has always been characterised by high vertical fiscal imbalances, on average between 60% and 70% of sub-national own spending was not financed through own revenues over the last two decades. This stems from strong revenue centralisation at the federal level and decentralisation of spending. Hence equalisation mechanisms from central to sub-central governments are a pervasive feature of Belgium.
The main financial transfer to the regions is the so-called federal personal income tax transfer. Since 1990, this transfer has been horizontally attributed to the regions according to each region’s contribution to federal personal income tax revenues. As compensation for the change in the horizontal allocation formula, an equalisation grant (mécanisme de solidarité nationale) has been attributed to the regions. A region whose per-capita revenues from personal income tax are lower than the national average receives a yearly transfer of €19.8 (in 2012) indexed per inhabitant per percentage point difference between the per-capita revenues from personal income tax and the national average. With the latest state reform, a new mechanism will be put in place. The compensation is computed on the differences between population and fiscal repartition keys.
Finally, each region obtains a closed-ended grant from the federal budget as compensation for each unemployed person for whom the region creates a job (Algoed, 2009).
LEVEL OF FISCAL DECENTRALISATION
In Belgium, the regions have a degree of revenue autonomy (i.e. own revenues relative to total resources available) of around 25%. This is well below the EU average of around 70%. A corollary of this low level is that the transfer dependency ratio (the share of expenditure covered by transfers) is higher than the EU average. By contrast, local governments have a higher degree of revenue autonomy, at around 50%, which is in line with the EU average. This is also the case for the fiscal imbalance and transfer dependency ratios. Discretion over taxation for revenues is also very high at the state level, but restrictive at lower levels of governance.
Source: authors’ elaboration on EUROSTAT data. For further details, see methodology.
Regions’ own revenues represent about 8% of total general government revenues (or about 4% of GDP); local revenue represents about 7.5% of total general government revenues (or 3.6% of GDP).
The composite ratio, which captures aspects of fiscal decentralisation of both revenue and expenditure, suggests that regions and communities have a degree of fiscal decentralisation just above the EU average (for federal nations), while that of provinces and municipalities is below the total EU average.
Province and municipalities have restricted powers in setting rates and reliefs, and full discretion is limited to a set of local taxes (less than 10% of the total).
Source: authors’ elaboration on EUROSTAT data. For further details, see methodology.
Fiscal rules and borrowing capacity
Numerical fiscal rules were introduced in 1990 to monitor the balance of the budget, expenditures and revenues of the federal government, as well as those of some sub-national governments. Although they have never been used, they would allow the federal level to impose borrowing limits on regions if they have not respected their budgetary targets. Regions cannot be liable, however, for providing fiscal surpluses to offset a potential federal deficit.
Two independent fiscal bodies – the National Account Institute (NAI) and a new section of the High Council of Finance (HCF) – give the federal and federated governments advice on public finance issues with the aim of reducing the debt ratio. The annual budget recommendations of the HFC's advisory section were the basis for budgetary conventions which acted as "internal stability pacts" by setting the medium-term budgetary targets for the different government tiers.
The increase in budgetary autonomy of sub-national governments with the last state reform includes the right to run deficits and to borrow accordingly. Although in the past budgetary correcting mechanisms existed at almost all government levels, now only an automatic compensation mechanism remains regarding health spending by the federal government (European Commission, 2012).
The local level (provinces and municipalities) and regional governments in Belgium score 6.41 and 6.02, respectively, in the European Commission’s composite index of fiscal rule strength, both below the EU average.
Deficit and debt at sub-national levels
According to Eurostat data in 2013, regions and communities reached a debt level of 7.5%, aggravated by the crisis which brought the debt level up from 3.9% in 2008. A consolidation effort is visible with borrowing and lending reaching a balance in 2013 and a first reduction in the debt level to below the 2010, 2011 and 2012 levels (7.6%, 7.8% and 8%, respectively). At the local level, the debt impact has been very limited, with a modest increase between 2009 and 2013 from 4.5% to 5.1% of GDP, but not exceeding that of the years 2000-06. Net borrowing increased during the crisis, but has decreased since 2012. The levels are nevertheless modest at -0.2% of GDP, and represent a marked improvement on the 2009-10 figure of -0.7%.
Source: authors’ elaboration on EUROSTAT data. For further details, see
methodology.
EXPENDITURE BY GOVERNMENT LEVEL AND BY POLICY AREA
In Belgium, sub-national governments have competences, which are often very large, in many policy areas. The federal state remains largely in charge of general public services, on which it spends almost two thirds of its budget, and it is the only government tier with competence over defence matters (approximately 5% of the budget). Although health is a person-related service and is therefore expected to be part of the communities' responsibilities, it is the federal state that has the largest spending power with respect to this economic function.
In 2012, community and region expenditure on education represented the largest share (92%) of total general government expenditure in the field. The next largest policy areas for federated entities, in terms of expenditure as a percentage of total public expenditure, are housing and community amenities and economic affairs (65% and 45%, respectively). These values are well above the EU average, indicating the large role of federated entities in many policy areas.
Source: authors’ elaboration on EUROSTAT data. For further details, see methodology.
In the budget of federated entities, education (38%) is by far the most significant spending item, followed by economic affairs (19%), social protection (18%) and general services (16%). Competences that are person-related are in the hands of the communities, whereas territory-linked areas are under the competence of the regions. Hence, communities are highly involved in education, as they finance large parts of primary, secondary and higher education. Regions are largely involved in economic affairs like agriculture and transport, as well as in environmental protection and housing.
Provinces and municipalities
The expenditures of provinces and municipalities represent a significant part of total general government expenditures in the fields of culture (52%), public order and safety (50%), environment (46%), and housing and community amenities (43%). While these values are high, most (except public order and safety) are below the EU average.
Source: authors’ elaboration on EUROSTAT data. For further details, see methodology.
At local level, provincial and municipal governments are mainly involved in social protection (22% of the total budget of the two entities), education (19%), general public services (18%) and public order and safety (13%). Provinces have spending power in certain person-related areas, like secondary and higher education, and are responsible for the general affairs of the provinces. Municipalities' spending competences include local planning, elections and registration, as well as policing and some education and social protection functions, such as public social welfare centres.
Source: authors’ elaboration on EUROSTAT data. For further details, see methodology.